Value stream management startup Tasktop has raised $100 million in a strategic venture round led by Sumeru Equity Partners.
Visualization
Data Visualization 102: The Most Important Rules for Making Data Tables
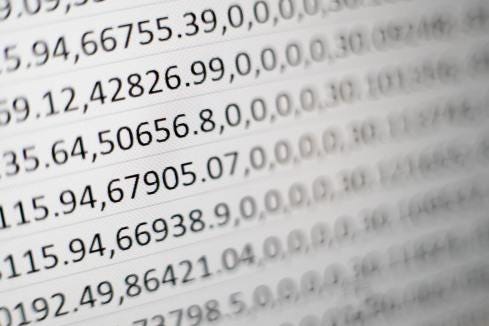
What are effective ways to use tables to convey information?Picture from Mika BaumeisterIn a previous post about data visualization in data science and statistics, I discussed what I consider the single most important rule of graphing data. In this post, I am following up to discuss the most important rules for making data tables. I will focus on data tables in reporting/communicating findings to others, as opposed to the many other uses of tables in data science say to store, organize, and mine data.
If Data Could Talk: Data Visualization + the Science of Magic
Host Andy Cotgreave is joined by researcher and magician - Dr. Gustav Kuhn - to discuss data visualization, breakdown the science of magic, and show us a few tricks along the way!
Top Data Visualization Tools & Software to Watch Out in 2021

Data visualization enables users to analyze the data and gain valuable insights. Businesses around the world are now able to capture customer experiences with their services or goods in order

Reflecting on a decade of data science and the future of visualization tools

Data science has exploded over the past decade, changing the way that we conduct business and prepare the next generation of young people for the jobs of the future. But this rapid growth was coupled with a still evolving understanding of data science work, which has led to a lot of ambiguity toward how we can use data science to derive actionable insights from our piles of data.
Time Series Data Visualization using Heatmaps in Python
This article was published as a part of the Data Science Blogathon. Introduction Time series is a series of data that are ...
Modernizing Data Dashboards.

Modernizing is critical to apply the latest technologies and practices to address areas where users are less than satisfied and data trust needs to be higher. In this article, learn about modernizing data visualization with dashboards and reports.
An Intuitive Guide to Data Visualization in Python
This article was published as a part of the Data Science Blogathon. Introduction Data visualization in python is perhaps one of the ..
Visualizing America’s Entrepreneurial Spirit During COVID-19
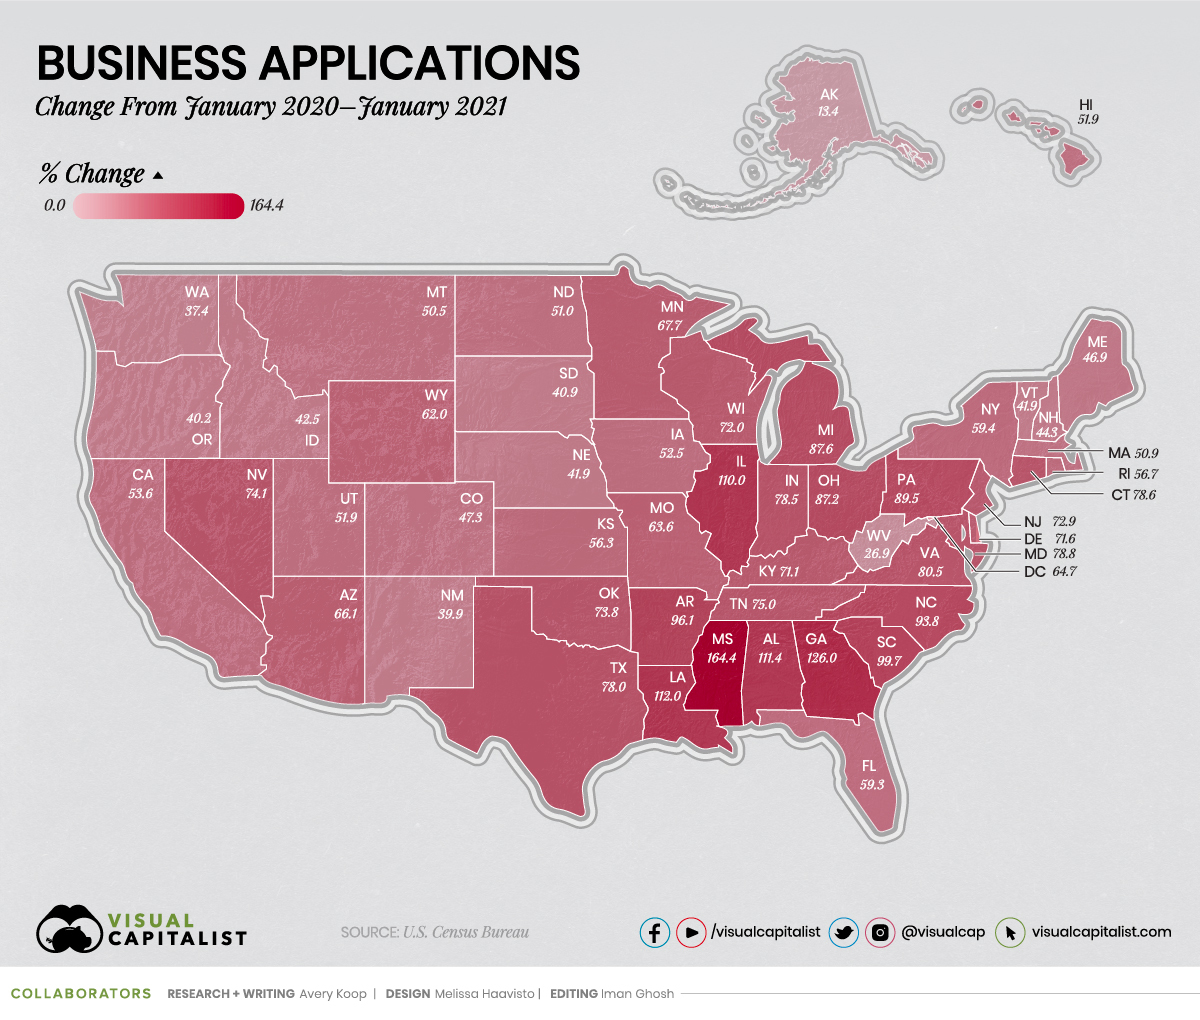
How have new business start-ups in the U.S. been impacted by COVID-19? New data reveals the resilience of the entrepreneurial spirit in America.
Telling a Great Data Story: A Visualization Decision Tree

Pick your visualizations strategically. They need to tell a story.
The World’s Most Searched Consumer Brands
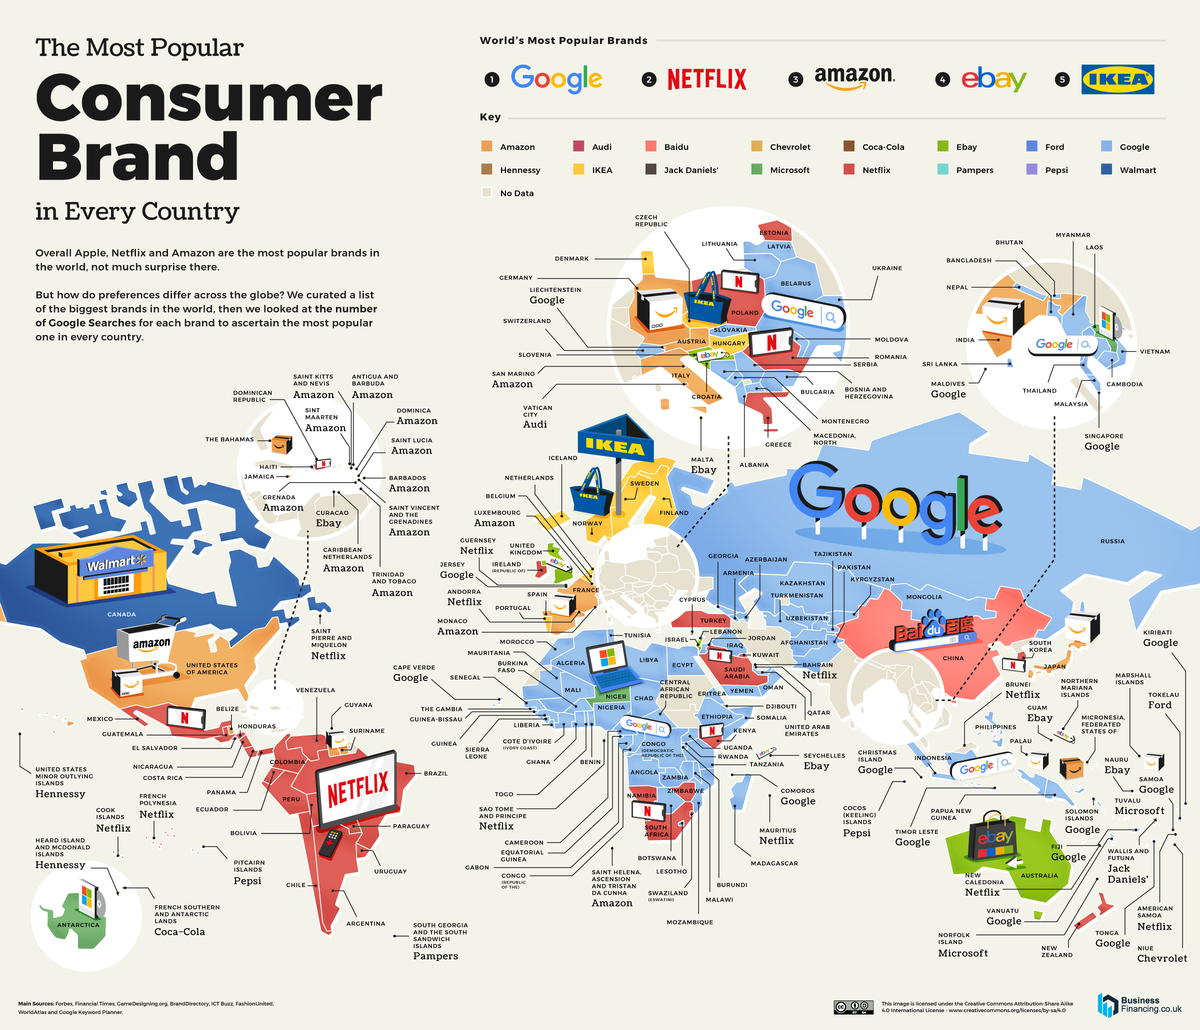
From Apple to Zara, this unique map showcases which popular consumer brands were searched for the most around the world.
Beautiful Mathematical Images
The topic discussed here is closely related to optimization techniques in machine learning. Dynamic systems, especially discrete chaotic ones, in two dimensions.
100 Beer Styles
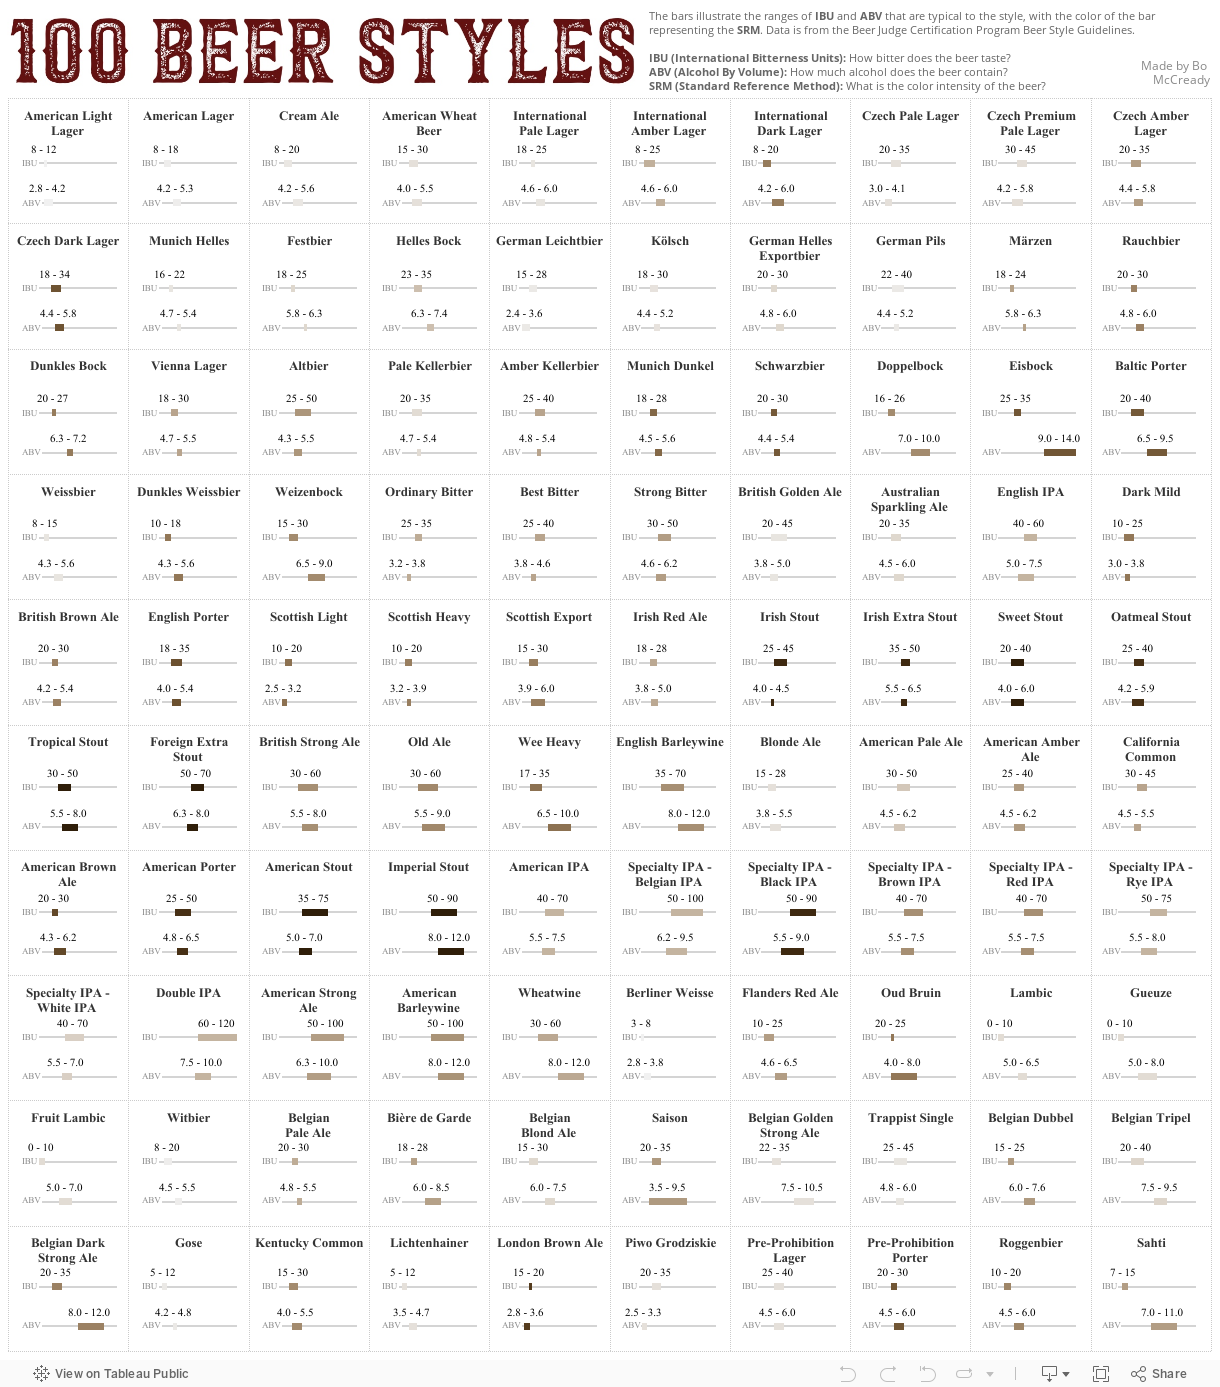
How well do you know the different beer styles and names? Or even what differentiates one beer from another? Dive into Bo McCready's visualization on all things beer and learn the ABV, IBU, and SRM ranges of each one of them.
